Exploratory Data Analysis: Everything you need to know
16 November, 2023

In the dynamic world of data science, Exploratory Data Analysis (EDA) stands as a cornerstone, essential for unlocking the full potential of data. This technique is more than just a preliminary step; it’s a critical process that shapes the understanding and interpretation of data sets. Through this article, we delve into the nuances of EDA, exploring its role, significance, and impact in data analysis. Whether you’re a seasoned expert or new to the field, understanding EDA is crucial for transforming raw data into actionable insights.
Exploratory Data Analysis (EDA), a pivotal tool in the data scientist’s arsenal, is employed to delve into and summarize the key features of data sets, often using visualization techniques. This process is central to understanding “what is exploratory data analysis”, and determining the most effective way to handle data sources for necessary insights. It enables data scientists to identify patterns, notice irregularities, test hypotheses, and verify assumptions.
The primary role of EDA, aligning with the definition of exploratory data analysis, is to uncover insights beyond standard modeling or hypothesis testing, enhancing understanding of the variables in a data set and their interconnections. Additionally, it assists in evaluating the suitability of statistical methods planned for data analysis. Developed in the 1970s by American mathematician John Tukey, EDA remains a fundamental and widely adopted approach in data exploration.

| Advantages | Disadvantages |
|
|
Learn more:
EDA is crucial for data scientists to know their dataset, including how it was gathered and where it comes from. It sheds light on the dataset’s structure, quality, and distinct features. Data scientists look into the types of data, key statistics, and how data points are spread to understand their primary attributes.
In EDA, it’s common to find missing values, outliers, and data inconsistencies. Cleaning and preparing the data correctly is vital for creating accurate and trustworthy models. Dealing with missing data is especially important at this stage, as it can significantly affect the analysis and how well the model works.
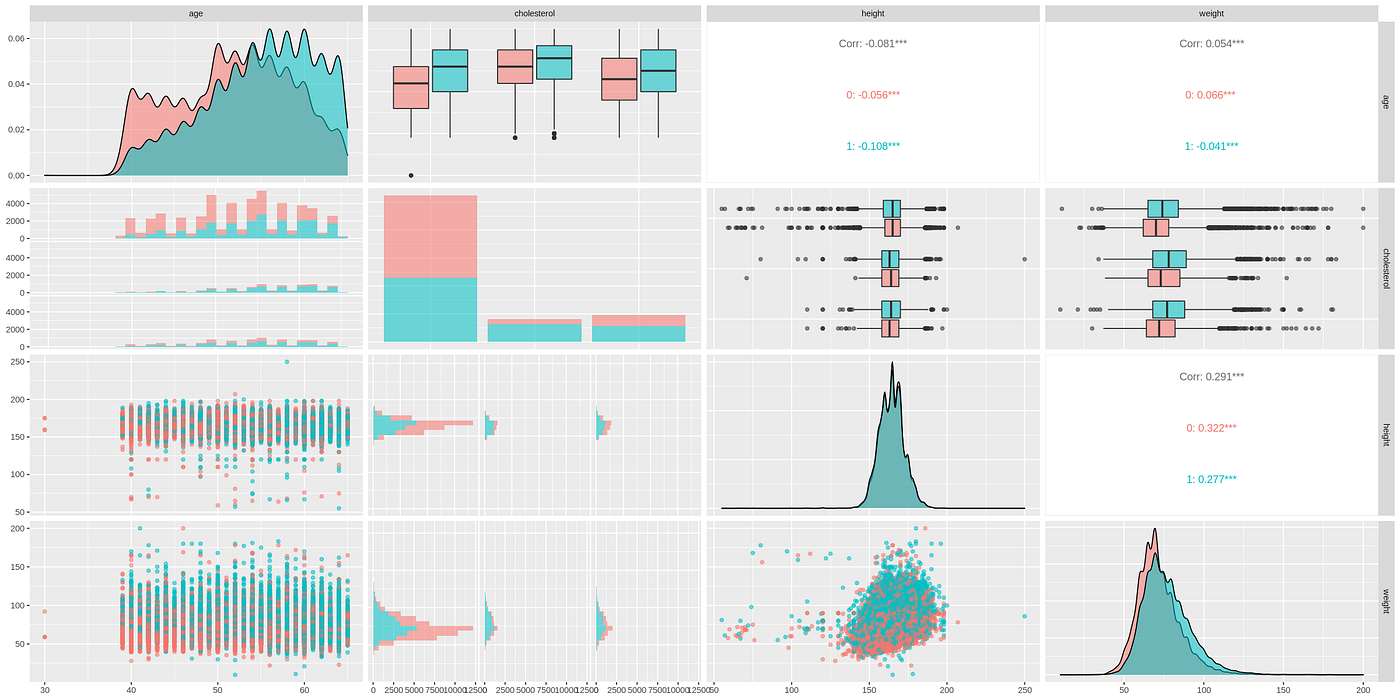
EDA methods help uncover patterns, connections, and trends in the data. A data scientist can spot patterns and correlations by doing univariate analysis and exploring how variables relate to each other through bivariate or multivariate analysis. This is useful for making well-informed decisions and developing hypotheses to examine exciting aspects of the data.
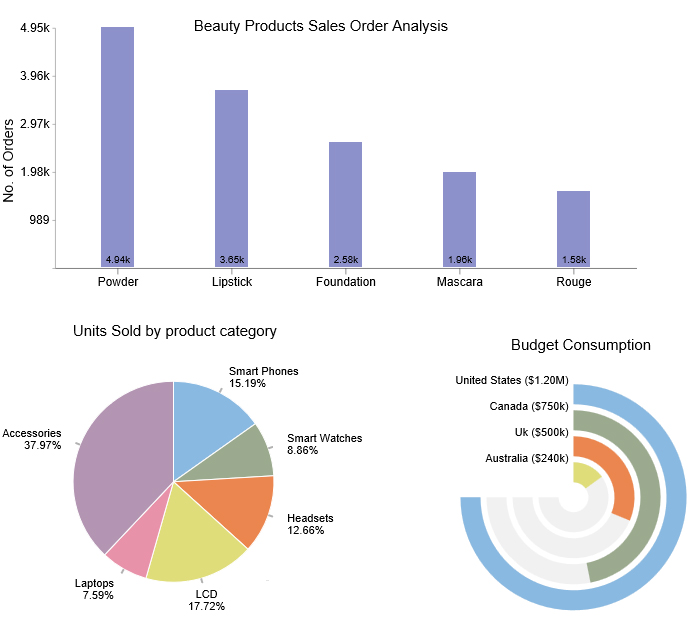
The visual tools used in EDA, like histograms, scatter plots, and box plots, simplify sharing findings with technical and non-technical audiences. These visualizations are compelling for storytelling, presenting the data’s narrative.
The insights from EDA guide data scientists in selecting the suitable models. For example, if EDA shows that variables relate in non-linear ways, it might lead to choosing models like decision trees or neural networks that handle non-linear relationships.
EDA helps identify data quality issues early on. Addressing these issues, like outliers and inconsistencies, is vital before moving on to modeling. Catching and fixing data quality problems early can save both time and effort.
EDA is not just important but a necessity in data science. It enables data scientists to make well-informed choices, understand the limits of their data, and pull out valuable insights, leading to more precise and meaningful outcomes. It’s critical in handling missing values, summarizing data points, and preparing the dataset for thorough analysis.
| Univariate Non-Graphical | Experts often turn to graphical methods to gain a complete understanding of data. These include tools like stem-and-leaf plots, box plots, and histograms, which provide a more detailed view than non-graphical techniques, especially in univariate data analysis. |
| Univariate Graphical | To gain a more complete understanding of data, experts often turn to graphical methods. These include tools like stem-and-leaf plots, box plots, and histograms, which provide a more detailed view than non-graphical techniques, especially in univariate data analysis. |
| Multivariate Non-Graphical | When dealing with multivariate data involving multiple variables, non-graphical methods are employed to explore the relationships between these variables. Techniques such as statistical analysis and cross-tabulation help understand the interconnections within the data. |
| Multivariate Graphical | Graphical techniques are essential for a visual representation of relationships in multivariate data. Popular methods include bar charts, heat maps, bubble charts, run charts, multivariate charts, and scatter plots. These tools visually depict the interactions between two or more data sets, offering a clearer insight into complex data relationships. |
Let’s dive into some of the essential tools of exploratory data analysis:
1. Python
Python is widely utilized for various tasks in EDA, including identifying missing data, describing datasets, managing outliers, and deriving insights through graphical representations. It supports EDA libraries such as Matplotlib, Pandas, Seaborn, NumPy, and Altair, which are known for their straightforward and beginner-friendly syntax. Additionally, Python offers numerous open-source tools like D-Tale, AutoViz, and PandasProfiling, which streamline the EDA process, enhancing efficiency and time management.
2. R
The R programming language is frequently chosen for its capabilities in statistical analysis and detailed EDA, particularly by data scientists and statisticians. As an open-source language, R is equipped for statistical computation and creating graphics. It includes popular libraries like ggplot, Leaflet, and Lattice, as well as specialized libraries for automated EDAs such as Data Explorer, SmartEDA, and GGally, adding to its robustness in data analysis.
3. MATLAB
MATLAB is a prominent commercial software, especially among engineers, due to its exceptional capabilities in mathematical computations. It can be applied in EDA, although it necessitates a fundamental understanding of MATLAB programming. Its solid mathematical foundation makes it a viable option for data analysis tasks.
EDA is an essential process in data science, crucial for uncovering insights, identifying patterns, and ensuring data quality. With tools like Python, R, and MATLAB, EDA becomes a powerful approach to understanding complex datasets. Whether you’re a beginner or an expert, EDA’s techniques and tools are indispensable in transforming raw data into actionable insights.
Are you unsure how to do exploratory data analysis and looking to harness the full potential of EDA for your data projects? Contact TECHVIFY today for top-notch services in data analysis. Our team of experts is equipped with the latest tools and techniques to help you make the most of your data. Let us guide you through the intricacies of EDA and unlock the actual value of your data. Reach out to TECHVIFY now for the best in data science solutions!
Please feel free to contact us for a free consultation: Data Engineering Consulting


Table of ContentsI. Exploratory Data Analysis: Overview1. What is exploratory data analysis (EDA)?2. Components of EDA3. Advantages and Disadvantages of Exploratory Data AnalysisII. The Importance of EDA in Data ScienceUnderstanding DataData CleansingDiscovering PatternsVisualizing DataChoosing ModelsQuality AssuranceIII. Exploratory Data Analysis Techniques and Tools1. Most Popular EDA Techniques2. Exploratory Data Analysis ToolsConclusion In the fast-evolving world of online dating, understanding the cost to build a dating app is vital for anyone looking to break into the market. From the initial concept to the final launch, the journey requires careful planning around feature selection, platform compatibility, and user security—each of which plays a…
22 October, 2024

Table of ContentsI. Exploratory Data Analysis: Overview1. What is exploratory data analysis (EDA)?2. Components of EDA3. Advantages and Disadvantages of Exploratory Data AnalysisII. The Importance of EDA in Data ScienceUnderstanding DataData CleansingDiscovering PatternsVisualizing DataChoosing ModelsQuality AssuranceIII. Exploratory Data Analysis Techniques and Tools1. Most Popular EDA Techniques2. Exploratory Data Analysis ToolsConclusion You’ve started a business, and now you need a website. But no one on your team knows much about coding, and hiring a full-time web developer just isn’t in the cards right now. Sound familiar? If so, outsourcing your web design might be the perfect solution. Whether you’re a startup…
21 October, 2024

Table of ContentsI. Exploratory Data Analysis: Overview1. What is exploratory data analysis (EDA)?2. Components of EDA3. Advantages and Disadvantages of Exploratory Data AnalysisII. The Importance of EDA in Data ScienceUnderstanding DataData CleansingDiscovering PatternsVisualizing DataChoosing ModelsQuality AssuranceIII. Exploratory Data Analysis Techniques and Tools1. Most Popular EDA Techniques2. Exploratory Data Analysis ToolsConclusion With much of our communication happening online, it’s no surprise that the dating world has also shifted in the same direction. In 2021, 49 million people in the U.S. alone turned to online dating services—whether to find a serious partner or just enjoy a fun date. The trend became even…
18 October, 2024


Thank you for your interest in TECHVIFY Software.
Speed-up your projects with high skilled software engineers and developers.
By clicking the Submit button, I confirm that I have read and agree to our Privacy Policy