Essential JavaScript Debugging Tools for Every Developer
03 October, 2023

Debugging JavaScript is an essential skill for every JavaScript developer, as it can help you write more reliable and efficient code. This article explores the importance of JavaScript debugging and common challenges faced during development. You also know the tools to make the debugging process more efficient, equipping you with the skills needed for cleaner, faster, and more reliable code.
A debugging JavaScript tool is a software application or feature that helps developers find and fix errors, bugs, and issues in their JavaScript code, making it easier to ensure that the code works correctly and as intended.
Utilizing tools can prevent common errors and guarantee well-structured, maintainable, and easily debuggable code. Having a suite of debugging tools for JavaScript is vital as it enables you to:
All major browsers have built-in developer tools that can be used to debug JavaScript code. These tools provide a variety of features, such as the ability to:
To open the developer tools in your browser, press Ctrl+Shift+I on Windows or Command+Option+I on Mac.
The console.log() and console.error() functions can be used to print messages to the console. This solution can be helpful for debugging errors, as it can help you to identify the point at which the error is occurring and the values of the variables involved.
To use the console.log() function, pass the message you want to print to the process as an argument. For example, the following code will print the value of the “myVariable” variable to the console:
console.log(myVariable);
To use the console.error() function, pass the error message you want to print to the function as an argument. For example, the following code will print the error message “An error occurred” to the console:
console.error(“An error occurred”);

Chrome & Firefox DevTools
Chrome DevTools is a built-in debugger in the Chrome browser. This tool provides a variety of features, including:
Firefox Developer Tools is a built-in debugger in the Firefox browser. This tool provides similar features to Chrome DevTools.
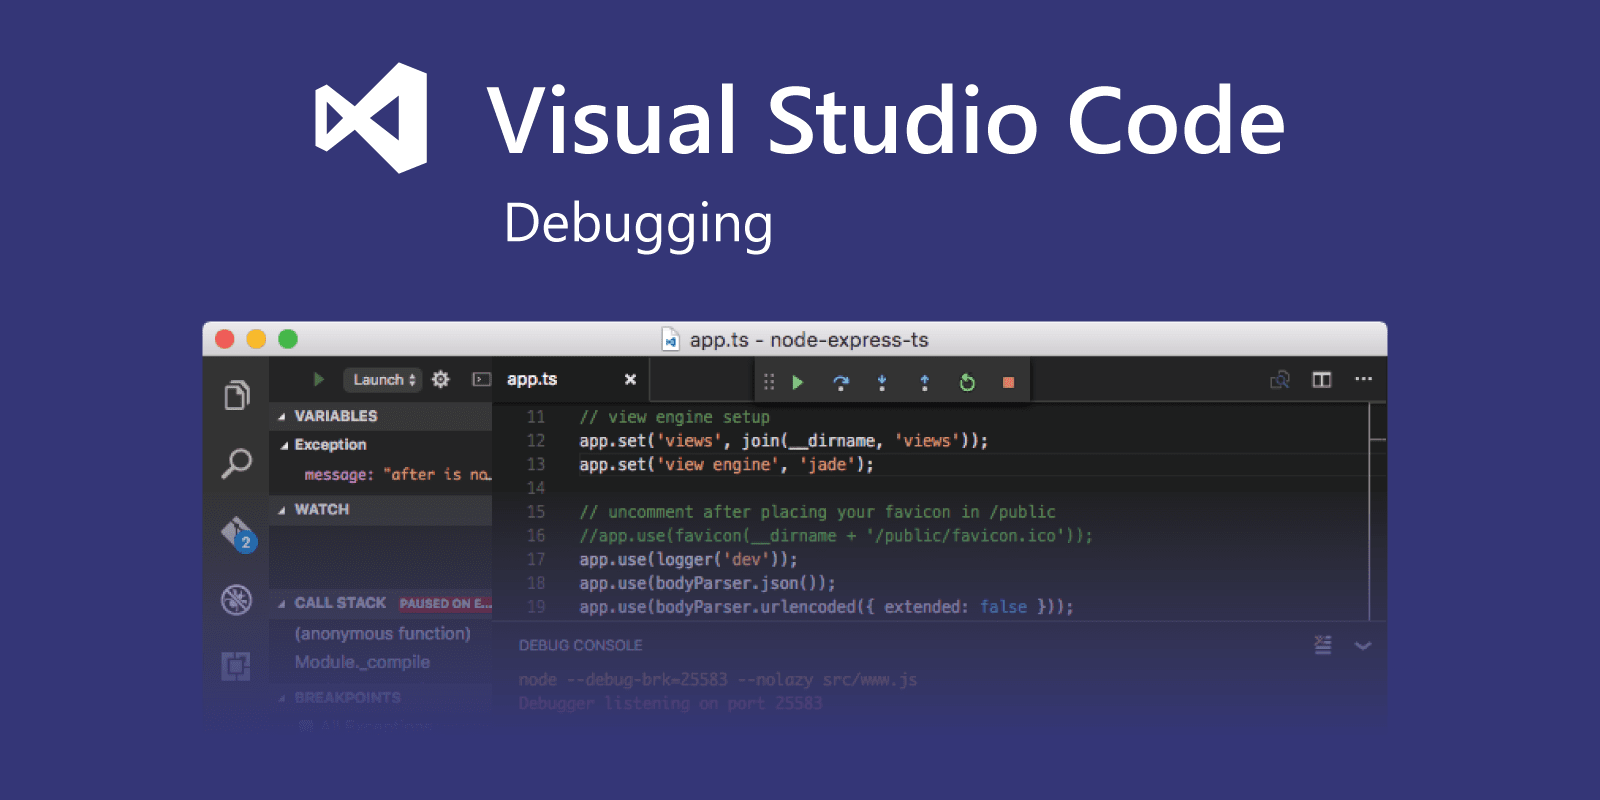
Visual Studio Code Debugger
Visual Studio Code Debugger is a third-party JavaScript debugger. This tool provides additional features beyond the built-in debuggers, such as:

ESLint
ESLint is a linter that helps you find and fix potential problems in your JavaScript code before it runs. It can check for syntax errors, coding style violations, and possible bugs.

Postman
Postman is an API development environment that lets you send HTTP requests and get responses. It’s a popular tool for testing and debugging APIs and can also be used to create and document APIs.
JS Bin
JS Bin is a web-based code editor and debugger that allows you to write, run, and debug JavaScript code in your browser. It is a powerful tool for developers of all levels and is especially useful for collaborative debugging.
Looking for more tools to enhance your business? See below:
| Challenge | Solution |
| Syntax Errors | Carefully check the syntax to identify errors. |
| Use a compiler or development environment to spot errors. | |
| Utilize console logs to display variable values and trace errors. | |
| Runtime Errors | Use try-catch to catch errors and handle them gracefully. |
| Employ console.log to log detailed error information. | |
| Use browser debugging tools to pinpoint errors precisely. | |
| Undefined Variables | Check if variables are declared before using them. |
| Use “use strict” to prevent accidental global variable creation. | |
| Infinite Loops | Identify the stopping condition in loops. |
| Use break or return to exit loops when necessary. | |
| Employ setTimeout to set a time limit on loops. | |
| Logic Errors | Review the source code logic to identify errors. |
| Use debugging tools to track variable values and execution flow. | |
| Use console.log statements to monitor information and values. |
In conclusion, mastering the debugging tool JavaScript is paramount. It elevates code quality, reduces development time, and instills confidence in code reliability. Equipped with essential tools and techniques, developers can efficiently resolve errors, ensuring code excellence throughout their projects and enabling a smoother development journey.
However, to ensure your application runs smoothly from start to finish, don’t hesitate to contact TECHVIFY. We offer end-to-end services to ensure your business doesn’t be disrupted and achieve a streamlined process. Our team of seasoned professionals is readily available to help you optimize your resources efficiently and cost-effectively.
Please feel free to contact us for a free consultation: Software Development Services


Table of ContentsThe OverviewWhat is a Debugging JavaScript Tool?Importance of Debugging Tool JavaScriptDebugging Tools JavaScriptBrowser Developer ToolsConsole.log() and console.error()Best JavaScript Debugging ToolsChrome & Firefox DevToolsVisual Studio Code DebuggerESLintPostmanJS BinCommon JavaScript Debugging Challenges and Best Practices to Resolve ThemOther Tips for Debugging JavaScript CodeConclusion In the fast-evolving world of online dating, understanding the cost to build a dating app is vital for anyone looking to break into the market. From the initial concept to the final launch, the journey requires careful planning around feature selection, platform compatibility, and user security—each of which plays a critical role in shaping both the app’s…
22 October, 2024

Table of ContentsThe OverviewWhat is a Debugging JavaScript Tool?Importance of Debugging Tool JavaScriptDebugging Tools JavaScriptBrowser Developer ToolsConsole.log() and console.error()Best JavaScript Debugging ToolsChrome & Firefox DevToolsVisual Studio Code DebuggerESLintPostmanJS BinCommon JavaScript Debugging Challenges and Best Practices to Resolve ThemOther Tips for Debugging JavaScript CodeConclusion You’ve started a business, and now you need a website. But no one on your team knows much about coding, and hiring a full-time web developer just isn’t in the cards right now. Sound familiar? If so, outsourcing your web design might be the perfect solution. Whether you’re a startup building your online presence or an established…
21 October, 2024

Table of ContentsThe OverviewWhat is a Debugging JavaScript Tool?Importance of Debugging Tool JavaScriptDebugging Tools JavaScriptBrowser Developer ToolsConsole.log() and console.error()Best JavaScript Debugging ToolsChrome & Firefox DevToolsVisual Studio Code DebuggerESLintPostmanJS BinCommon JavaScript Debugging Challenges and Best Practices to Resolve ThemOther Tips for Debugging JavaScript CodeConclusion With much of our communication happening online, it’s no surprise that the dating world has also shifted in the same direction. In 2021, 49 million people in the U.S. alone turned to online dating services—whether to find a serious partner or just enjoy a fun date. The trend became even more pronounced in 2020, as men and…
18 October, 2024


Thank you for your interest in TECHVIFY Software.
Speed-up your projects with high skilled software engineers and developers.
By clicking the Submit button, I confirm that I have read and agree to our Privacy Policy